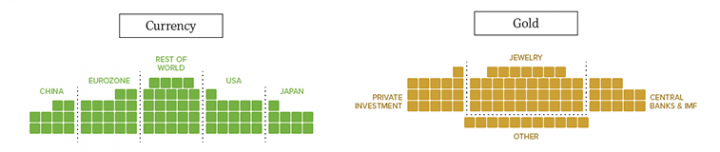
From the Visual Capitalist, an infographic that helps you visualize all the world’s money…

I cut off the bottom of the original graphic, which is derivatives, as (a) that market is humongous, but (b) the net total of the trillions in derivatives is $0, as every buyer has a matching writer, and thus that is a zero-sum market, unlike stocks or housing or gold.
Hopefully the Visual Capitalist team will provide a second view of this data someday, one that shows how much of this money is owned by the top 1%, by the next 9%, and the bottom 50%. That is the space I was reading about earlier this year before I got distracted by books about impact investing.
It wouldn’t take the much time to create that image, as the bottom 50% of the world own a block smaller than the total amount of silver. A block smaller than every other block on this chart. Four pixels on my screen, in an image that stretches 800 pixels wide by over 4,300 pixels tall.