
Ah… the proverbial hockey stick in a startup’s financial projections. No one believes it, and yet it must be included in any investor pitch.
Why? Two reasons. First and foremost, investors are looking for big opportunities, and if the revenue forecasts grow exponentially, that serves as a proxy to claim a large opportunity exists. Second, investors want their money back (and more), and they only way they (think they) can do that is my having the company grow at least 10x in value, necessitating fast growth.
The problem with the hockey stick is also twofold. First, no savvy investor ever believes those projections, with few taking the time to dig in to understand and work through a more realistic outcome. Second, most entrepreneurs have no idea how fast startups are expected to grow, but know they need to include a hockey stick, and the result of that is more often than not, a crazy, unjustified, unrealistic series of revenues.
For example, yesterday I received a plan with $3 million of revenues in the first year, growing to $300 million in the third year. All on an investment of a few hundred thousand dollars. How realistic is that? Not at all. Not a plan that has ever happened before.
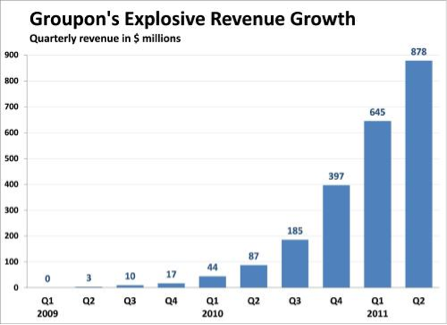
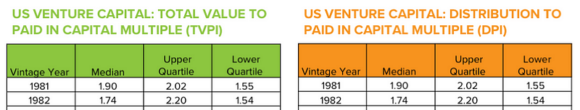
How do I know? On the left below is the actual revenue growth of the fasting growing company in the history of mankind, Groupon. $30 million in revenues in their first year of sales (not their first year of operations, as the whole idea of group coupons took quite a few pivots to discover). By year two they topped a half billion in revenues, and more than a billion in year 3.
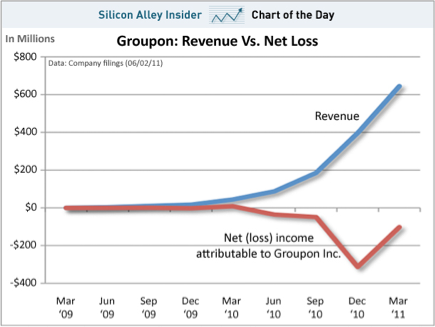
Problem for Groupon is the chart on the right above. Despite all that growth, the business was not anywhere near profitable. Their astounding hockey stick revenues was purchased far more than earned, paying customers cash to take Groupon’s product. This can be seen in the net loss in red. Groupon spent more than $1 for each $1 of revenues. They did manage to eventually get the losses down to zero, and go public, but Groupon did not turn out to be the huge success matching its initial hype.
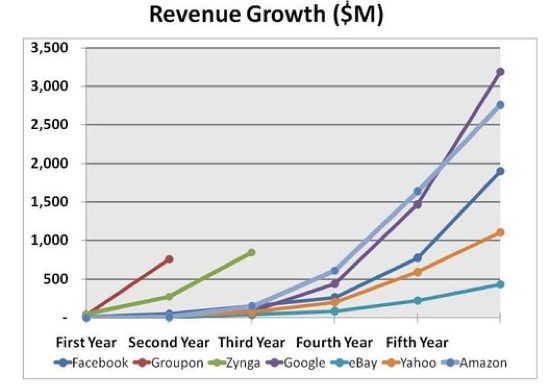
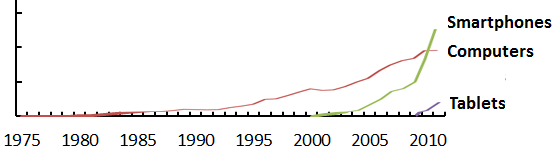
Looking at a few other high growth stories, in the graph below we see how incredibly fast Groupon’s growth truly was. Skip over Zynga, as it’s another boom and bust story. Facebook and Google, unarguably two of the most successful companies of the early 21st Century, both took four years to grow to hundreds of millions of dollars in revenues. Both raised hundreds of millions of dollars to achieve that much growth. Both now earn billions of dollars of profits. Moving on to the slowest growth on this chart we find Amazon. It’s clearly another powerhouse of the 21st Century, but was only at tens of millions in revenues in its third year, taking six years to reach $500 million.

Odds are incredibly low that you are building the next Amazon-scale business, or Google, or Facebook. Odds are your first year of revenues, if successful, will be still be in the single digit millions in your fifth year. The following table shows three realistic sets of revenue projections for three different paths of startups.
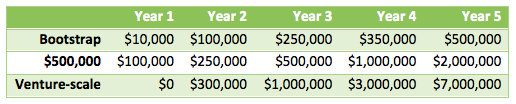
First is for the bootstrappers, which I’m defining as those entrepreneurs who are paying for their startup out of their own savings, from their credit cards, and at most from a few tens of thousands of dollars in crowdfunding and accelerator stipends. I’ve yet to see a bootstrapper who has earned even $100,000 in their first year of business.
Second is for those companies that raise the proverbial half million from Angels (anywhere from $200,000 to $800,000 fits this pattern), who use that funding to crack $100,000 in revenues in the first year. Unfortunately, more often than not, those are the only revenues they ever see. But if they do manage to raise a bit more funding from Angels or find the rare path to earn a net profit on a single round of funding, then doubling revenues year over year is reasonable.
Third and lastly are the venture-scale companies that receive all of the press coverage. These are rare, less than 0.05% of all (American) startups. Most of these pass through the second row before they raise any money from venture capitalists. In that path it is not uncommon for them to focus on usage of their product/service rather than revenues, and thus often they have $0 in revenues in Year 1. But once funded they are expected to get to $1 million in revenues in a year or two, and to triple or quadruple revenues year after year beyond that. (Read The Saas Adventure to understand how to realistically grow to $100 million in 7 years.)
Any business plan showing greater growth than this table make the eyes roll of sophisticated investors. Any business plan showing slower growth makes investors more often toss the plans away as too small to be “investable”. There is a fine line of what looks reasonable for revenue growth, and now you have some idea where that line sits.
Thank you to Donald Marron, The Business Insider ,and The Wall Street Journal for the graphs.


[…] Click here to read this article as it appears on Luni’s blog! […]
[…] what happens when investors seek hockey stick growth projections for a coffee chain when they are otherwise used to scaling metrics such as billions of […]