All journeys begin with a first step.
Finally, it is time to open up a blank spreadsheet and begin building an actual financial plan!
As we build this out, remember that the financial plan needs to tell a story. It needs to explain how and when your business will be profitable and how much investment will be needed to get there.
To ensure this story is as clear, logical, and believable as possible, we need to lay out the details in a clear and logical order. Refer to the spreadsheet at the end of this chapter as I walk you through the story.
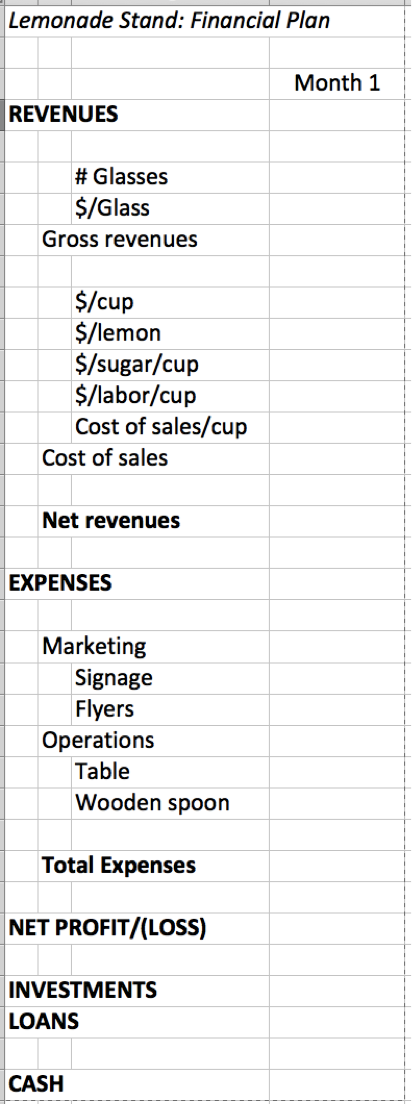 Revenues
We begin with a time period. One month is typical. We put in two educated guesses:
- number of units sold in one month and
- price per unit.
We then multiply these together to determine income, a.k.a. revenues. For the lemonade stand, to find the revenues, you multiply the number of glasses you plan to sell each month by the price per glass. The result tells us how much money we expect customers will give us. That number is called the “top-line” revenue of the business. In accounting, it is also known as “gross” revenue.
Next, we need to talk about the costs involved in making all that lemonade. How much money are we going to spend in order to give customers lemonade? From the back-of-the-envelope plan, we know that the cost of goods per unit includes the empty cup, one lemon, some sugar, and some labor. Add that all together to get the cost of goods for one glass of lemonade. But we plan to sell more than one glass. So, multiply the cost per glass by the total number of glasses sold to get the total cost of goods for the month.
Take the “top-line” revenue (i.e., the total amount of money you receive from your customers) and subtract the cost of goods (how much money you spend to make lemonade) to get the net revenue.
You spend money (cost of goods) to create and sell a product. You get money from the customer for that product (top-line revenue). After paying yourself back, the leftover money is the net revenue. You can think of the net revenues as your true income, since you had to spend money to make money.
For your business, details of your revenue will be different (unless you are also selling lemonade). Include all the important components so that anyone reviewing your plan will understand how your company earns money and how those revenues will grow as your company grows.
While filling out your spreadsheet, remember that the result is only a financial model. It is not reality. Models help us focus on the important details; the minor details can be left out. For example, the cost of goods in the lemonade plan does not include the water or ice or a napkin. It is assumed that these costs will be negligible; adding items to the model that do not significantly change the results is a waste of time. Such details also add a level of complexity that detracts from the storytelling.
Fixed Expenses
Moving beyond revenues, the next part of the story is about expenses. Remember, the fixed expenses are those costs that do not vary depending on the number of units sold.
For our lemonade business, the fixed expenses include what we pay for marketing and basic operations. The marketing expenses are further divided into signage and flyers. Operations include the cost of the table and a spoon to stir the ingredients.
For your business, there should be far more expenses, including salaries, rent, insurance, phones, Internet, postage, travel, entertainment, and so on. However, these expenses work in exactly the same way as those on the short list in the lemonade plan.
The key number for expenses is the sum of all fixed costs.
Net Profit/Loss
Once you have estimates for revenues and expenses, you have enough information to figure out if your company will make money or lose money. Making money is called making a net profit. Losing money is called a net loss. You calculate how much you make (or lose) by taking your net revenues and subtracting your expenses.
For most startups, the first month, first quarter, and first year all have net losses. For some startups, there are losses for a few years.
Remember, the key question you are trying to answer is whether your business will ever earn a profit. To answer this question, look at the “net profit” line in the spreadsheet. Looking into the future, does it ever become a positive number?
Investments and Loans
If you know basic accounting, then the financial plan up to this point may remind you of a “P&L,” a.k.a. a profit and loss statement or an income statement. However, this is a startup financial plan, and it continues onward with a few sections that P&Ls do not typically contain.
These sections exist because we are not done telling our story. You need money to run a business. But since most startups lose money for a while, we need to explain how we will make up the difference. There are two common ways to do this: investments and loans.
The investments line is not about your company making investments. Rather, it is about other people making investments into your company. This happens when you find an investor who buys equity in your company. If you sell part of your company to an investor for $100,000, then you put the $100,000 on the investments line.
Or you may take out a loan from a bank (or friends and family) to provide money to your company, or you may use a line of credit secured by your house. Some entrepreneurs run up their credit card bills with company expenses. In all these cases, the company is borrowing the money it needs, and such money gets put on the line labeled “loans.”
Additionally, you may receive grants or gifts or donations or prizes at a business plan competition, etc. This money is nice, because you do not have to pay it back. None of these are revenue, and yet it is money you can spend on your business. So you don’t put these funds in the revenue section of the financial plan. Instead, you add a line down in this “Investments and Loans” section with an appropriate label.
Cash
Last but not least, we have the most important section in the whole financial plan: the line that tells us how much cash the company has.
To compute the cash, we use a formula unlike all the others in the spreadsheet. The cash value in any column (remember, columns denote time periods) is the cash from the previous time period plus the net income, investments, and loans from the current time period.
This is important, so let me explain it twice. The revenues for one time period are all listed in a single column. The total expenses for that same time period are all listed in that same single column. The net income/loss for that time period is the difference of revenues and expenses within that column. The investments and loans for that time period are again all found in that one column. Cash, however, is a running total; it takes the cash value from the previous column and adds to it the net income, investments, and loans.
The reason we compute cash in this way is because we need to know if and when the company will run out of cash. If there is no cash, then we cannot operate the business. No cash, no payroll. No payroll, no employees. No cash, no money to pay for the cost of goods. No goods, and there is nothing to sell.
If you run out of cash, your company dies and, with it, your dream.