
With twelve months of a financial plan on the spreadsheet, the next step is to create an annualized summary for Year 1.
There are quite a few ways to organize annual summaries with no one best way.
My favorite way uses a feature within Excel called “Groups.” In my version of Excel, this can be found on the “Data” ribbon. This grouping function allows a series of columns to be hidden (and unhidden) by clicking a control that appears above the rightmost column. (This feature can be seen in the spreadsheet below as the box above column P.)
This grouping function allows a series of columns to be hidden (and unhidden) by clicking a control that appears above the rightmost column.
When using this feature, the annual summary is always shown, and the monthly or quarterly data can be hidden away until such details are needed.
When creating an annual summary, pay attention to which rows have values that can be summed into a total. For some rows, summing up the values would make no sense. For example, you can sum the number of glasses and sum the revenues to create totals for the year, but the sum of the price of sugar is meaningless.
In the lemonade plan, all the rows where totals make sense use the SUM formula to create the annual total from the monthly data. To make it clear that these values are sums, I format them as bold.
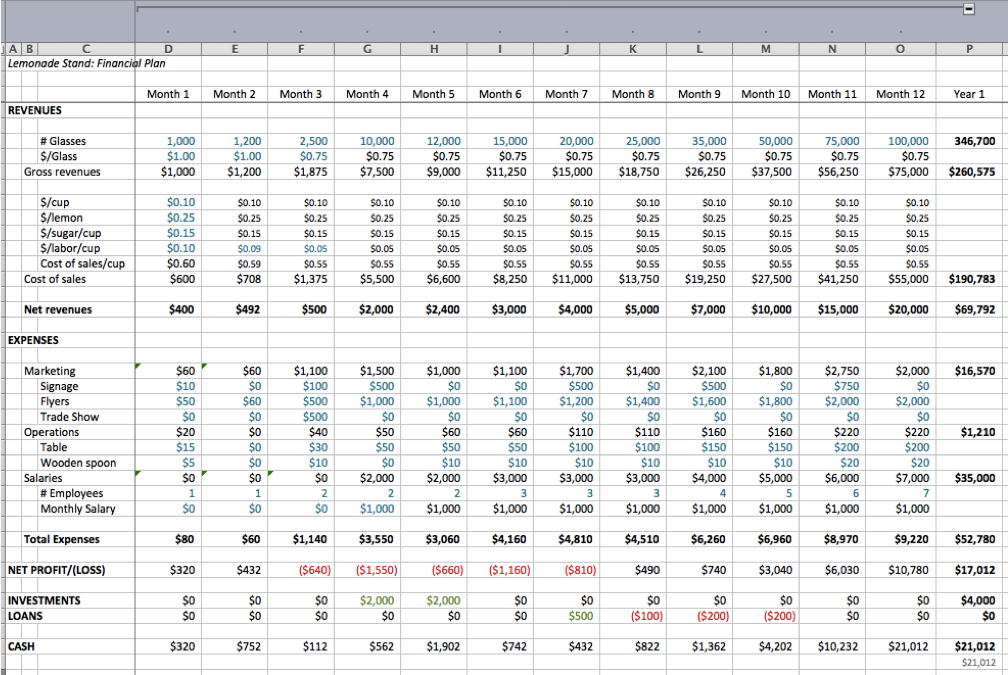
Do note that the cash line should not be summed, since it is a running total for the month! The cash for the year is just the ending cash for Month 12. Since cash is such an important metric in the financial plan, I include a double-checked value in this spreadsheet. This is the small, gray value underneath the cash line for Year 1. It is the same formula used in Month 1. Take the net profit/loss for the year, and add the investment and loans to it.
With these annual totals, it is much clearer how big this lemonade business is expected to be by the end of the first year. Almost 350,000 glasses of lemonade sold. Over $250,000 dollars in “gross” revenues. $52,000 in expenses. All on just $4,000 in investments, plus a small loan that was paid off so quickly, it does not even appear in the annual summary.
Once you have the first annual summary for your business, it is time to look through the values again and question whether they look reasonable. If the revenues seem high, go back month by month and lower the projections. If the expenses seem low, go back and find the right time to add in enough expenses to justify your revenues.
For the lemonade plan, it seems unlikely that $16,000 in marketing will drive $250,000 in sales. It seems even more unlikely that a business generating $250,000 in sales would pay only $35,000 in total salaries for the year. The number of employees needed and salaries for those employees is probably underestimated.